Clearer Data. Stronger Conversations. Better Decisions.
Most data dashboards are technical builds.
Ours are instructional tools.
Because EKC works inside classrooms and alongside leadership teams, we design dashboards that support real instructional decisions — not just reporting.
We think about:
How teachers will talk about this data
What questions leaders will ask
How patterns will translate into action

The Problem
The data exists — in many different places.
In many schools, assessment data lives in multiple spreadsheets, platforms, and reports. MAP is in one place. Classroom data is somewhere else. Benchmark data sits in a different folder.
The result?
Conversations feel fragmented
Patterns are harder to spot
Time is spent organizing data instead of responding to it
Meetings focus on numbers rather than instructional next steps

THE SOLUTION
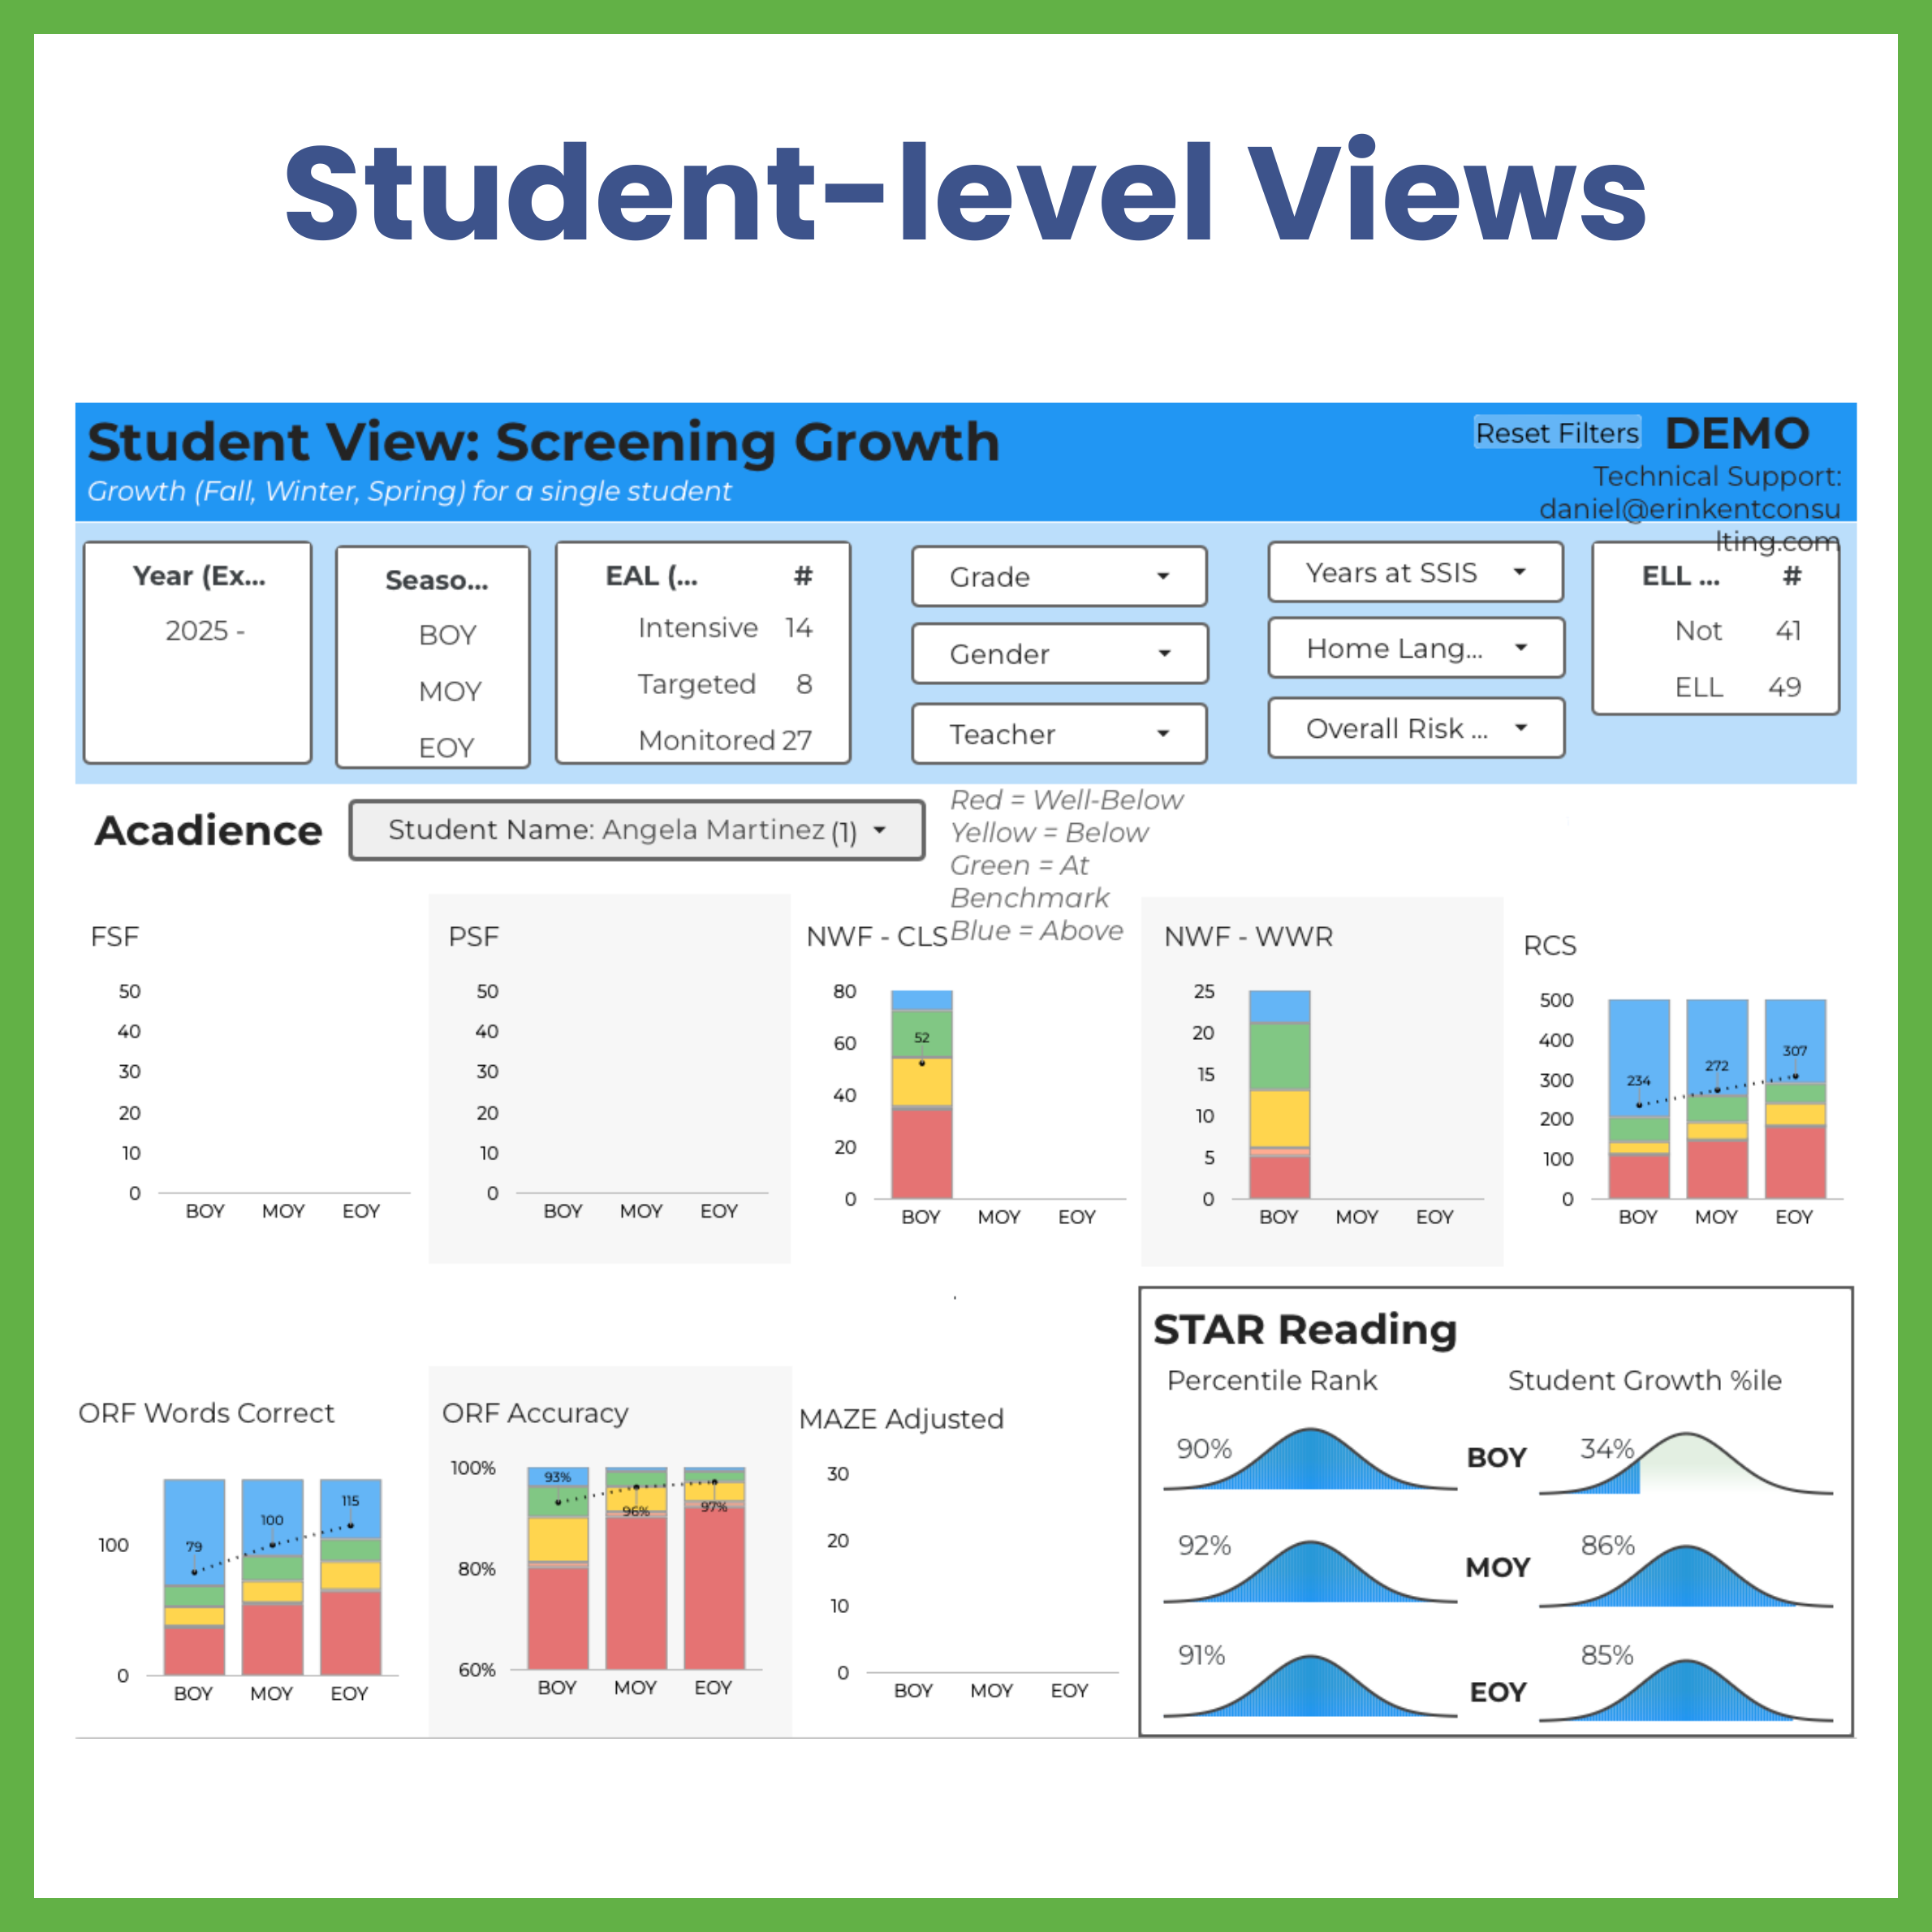
The EKC Customized Data Dashboard organizes the assessments you already use into a clear, shared visual system.
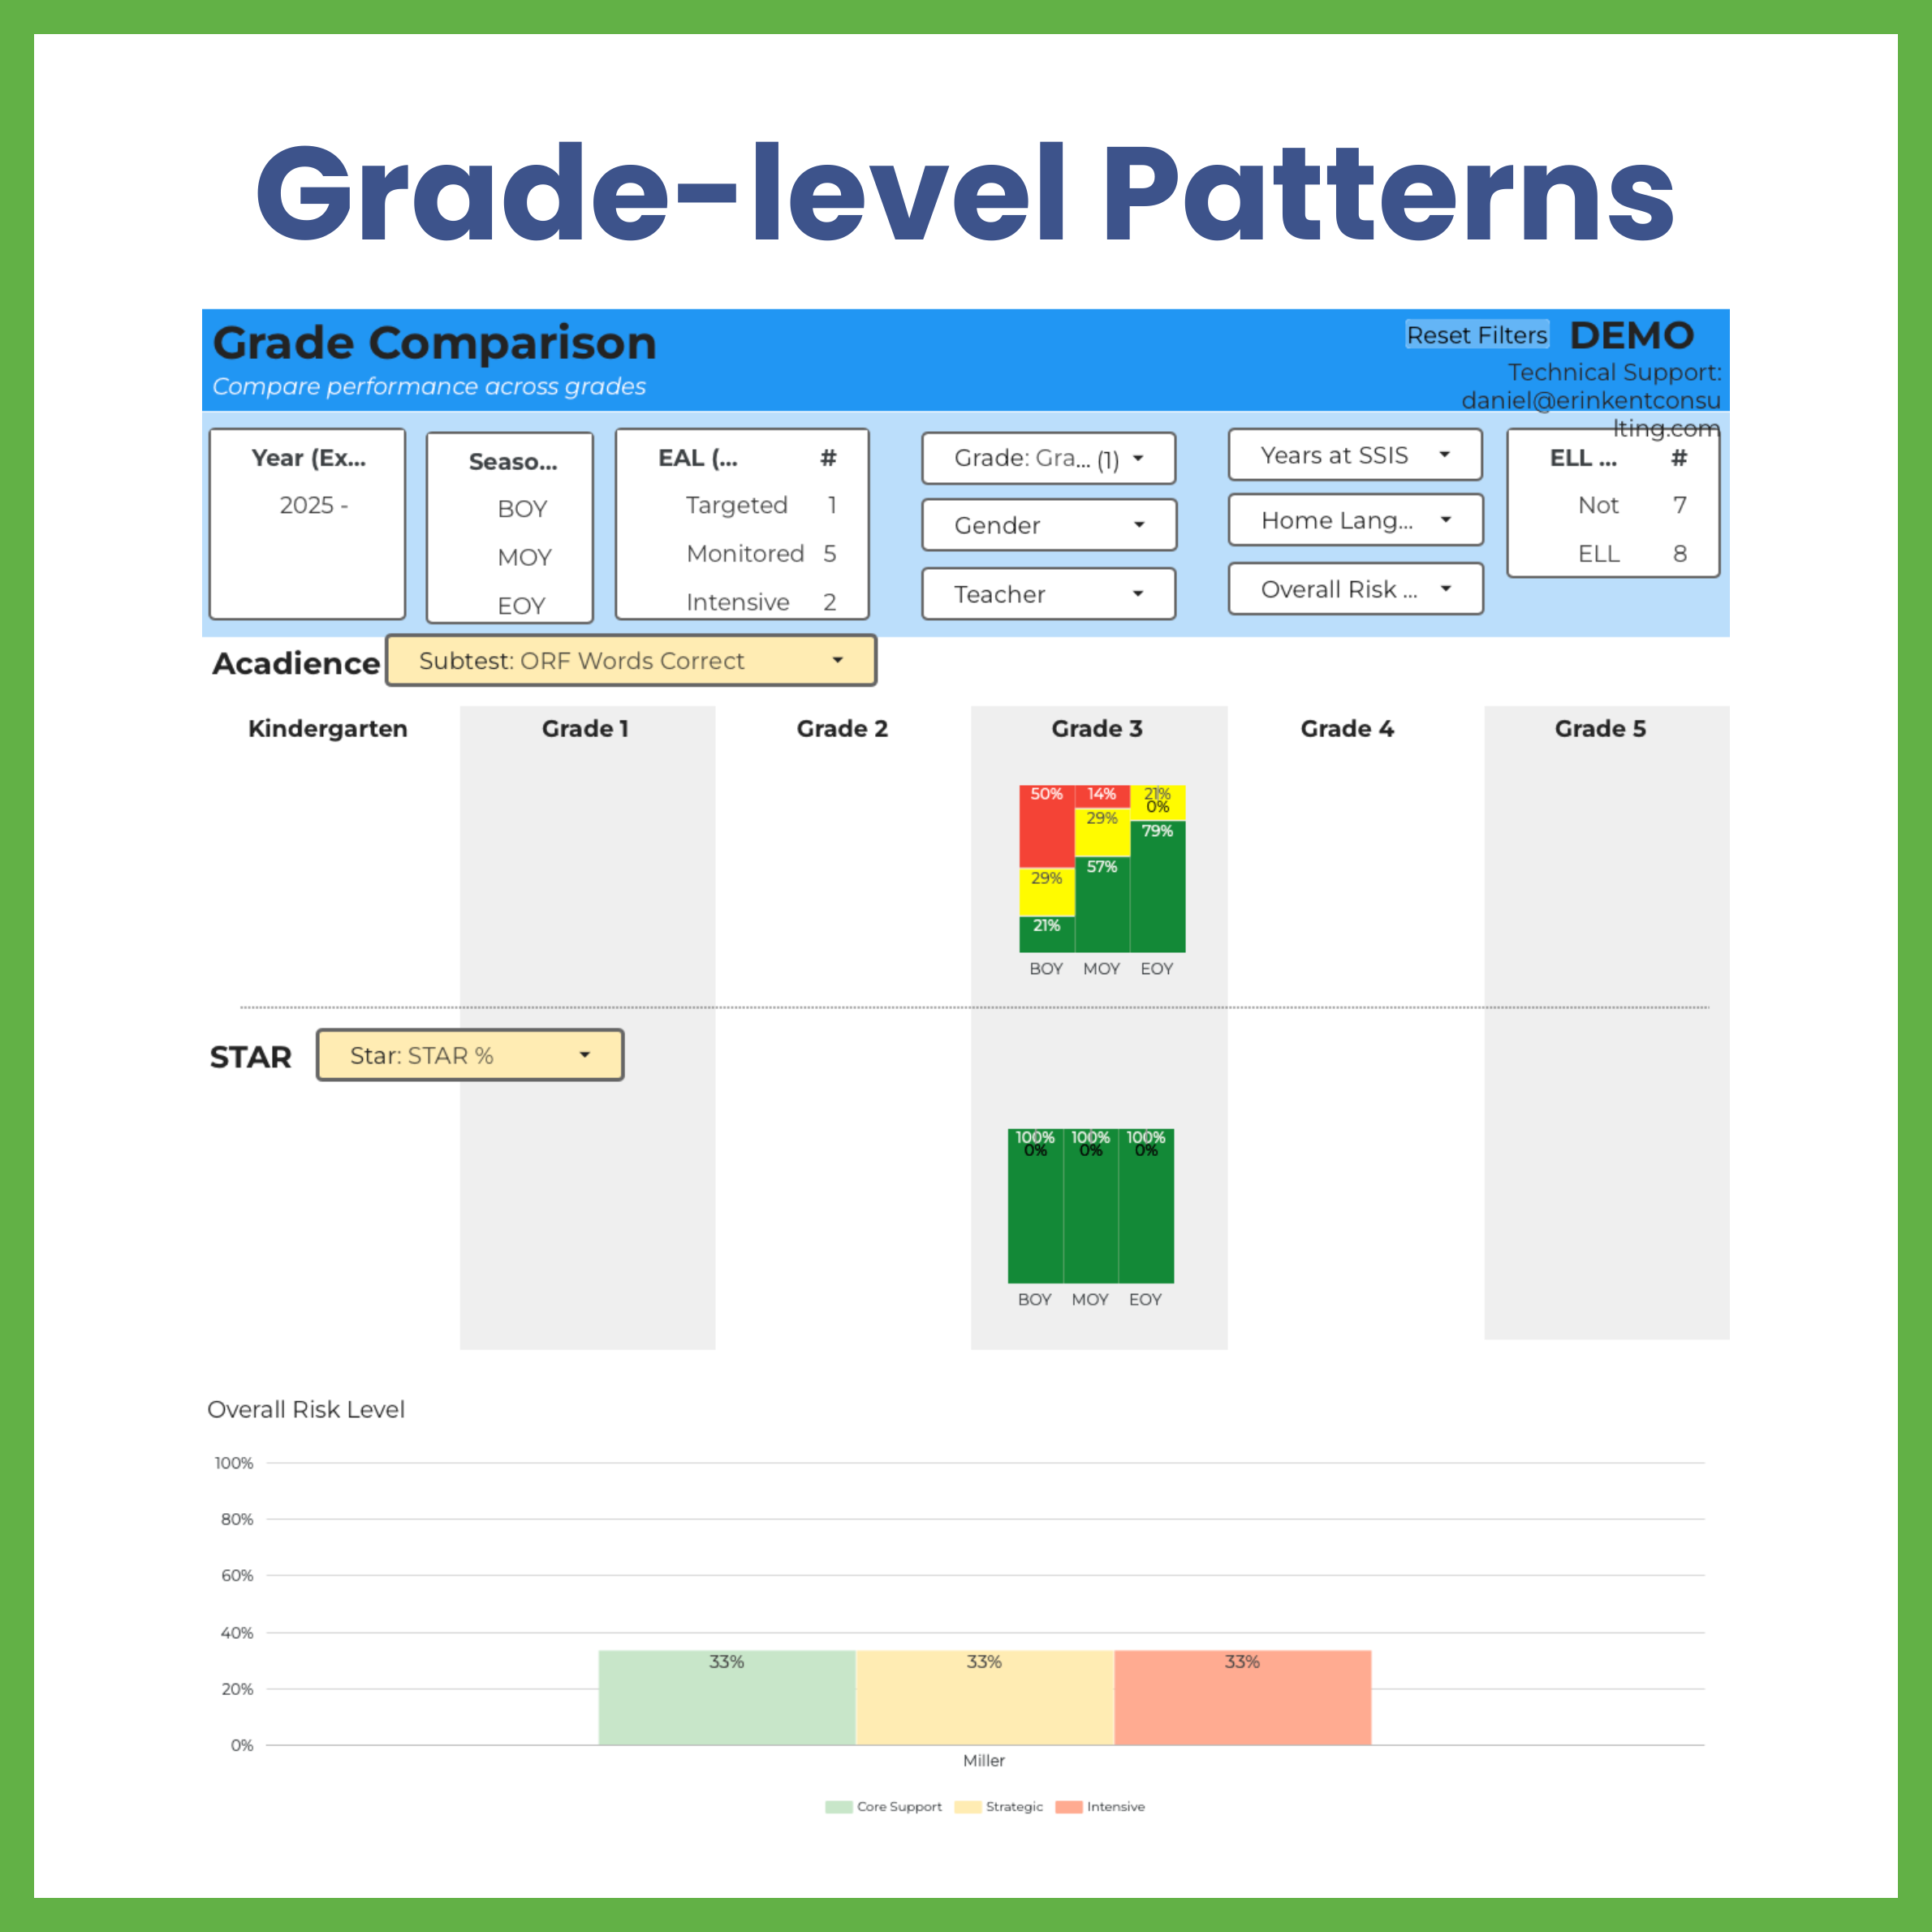
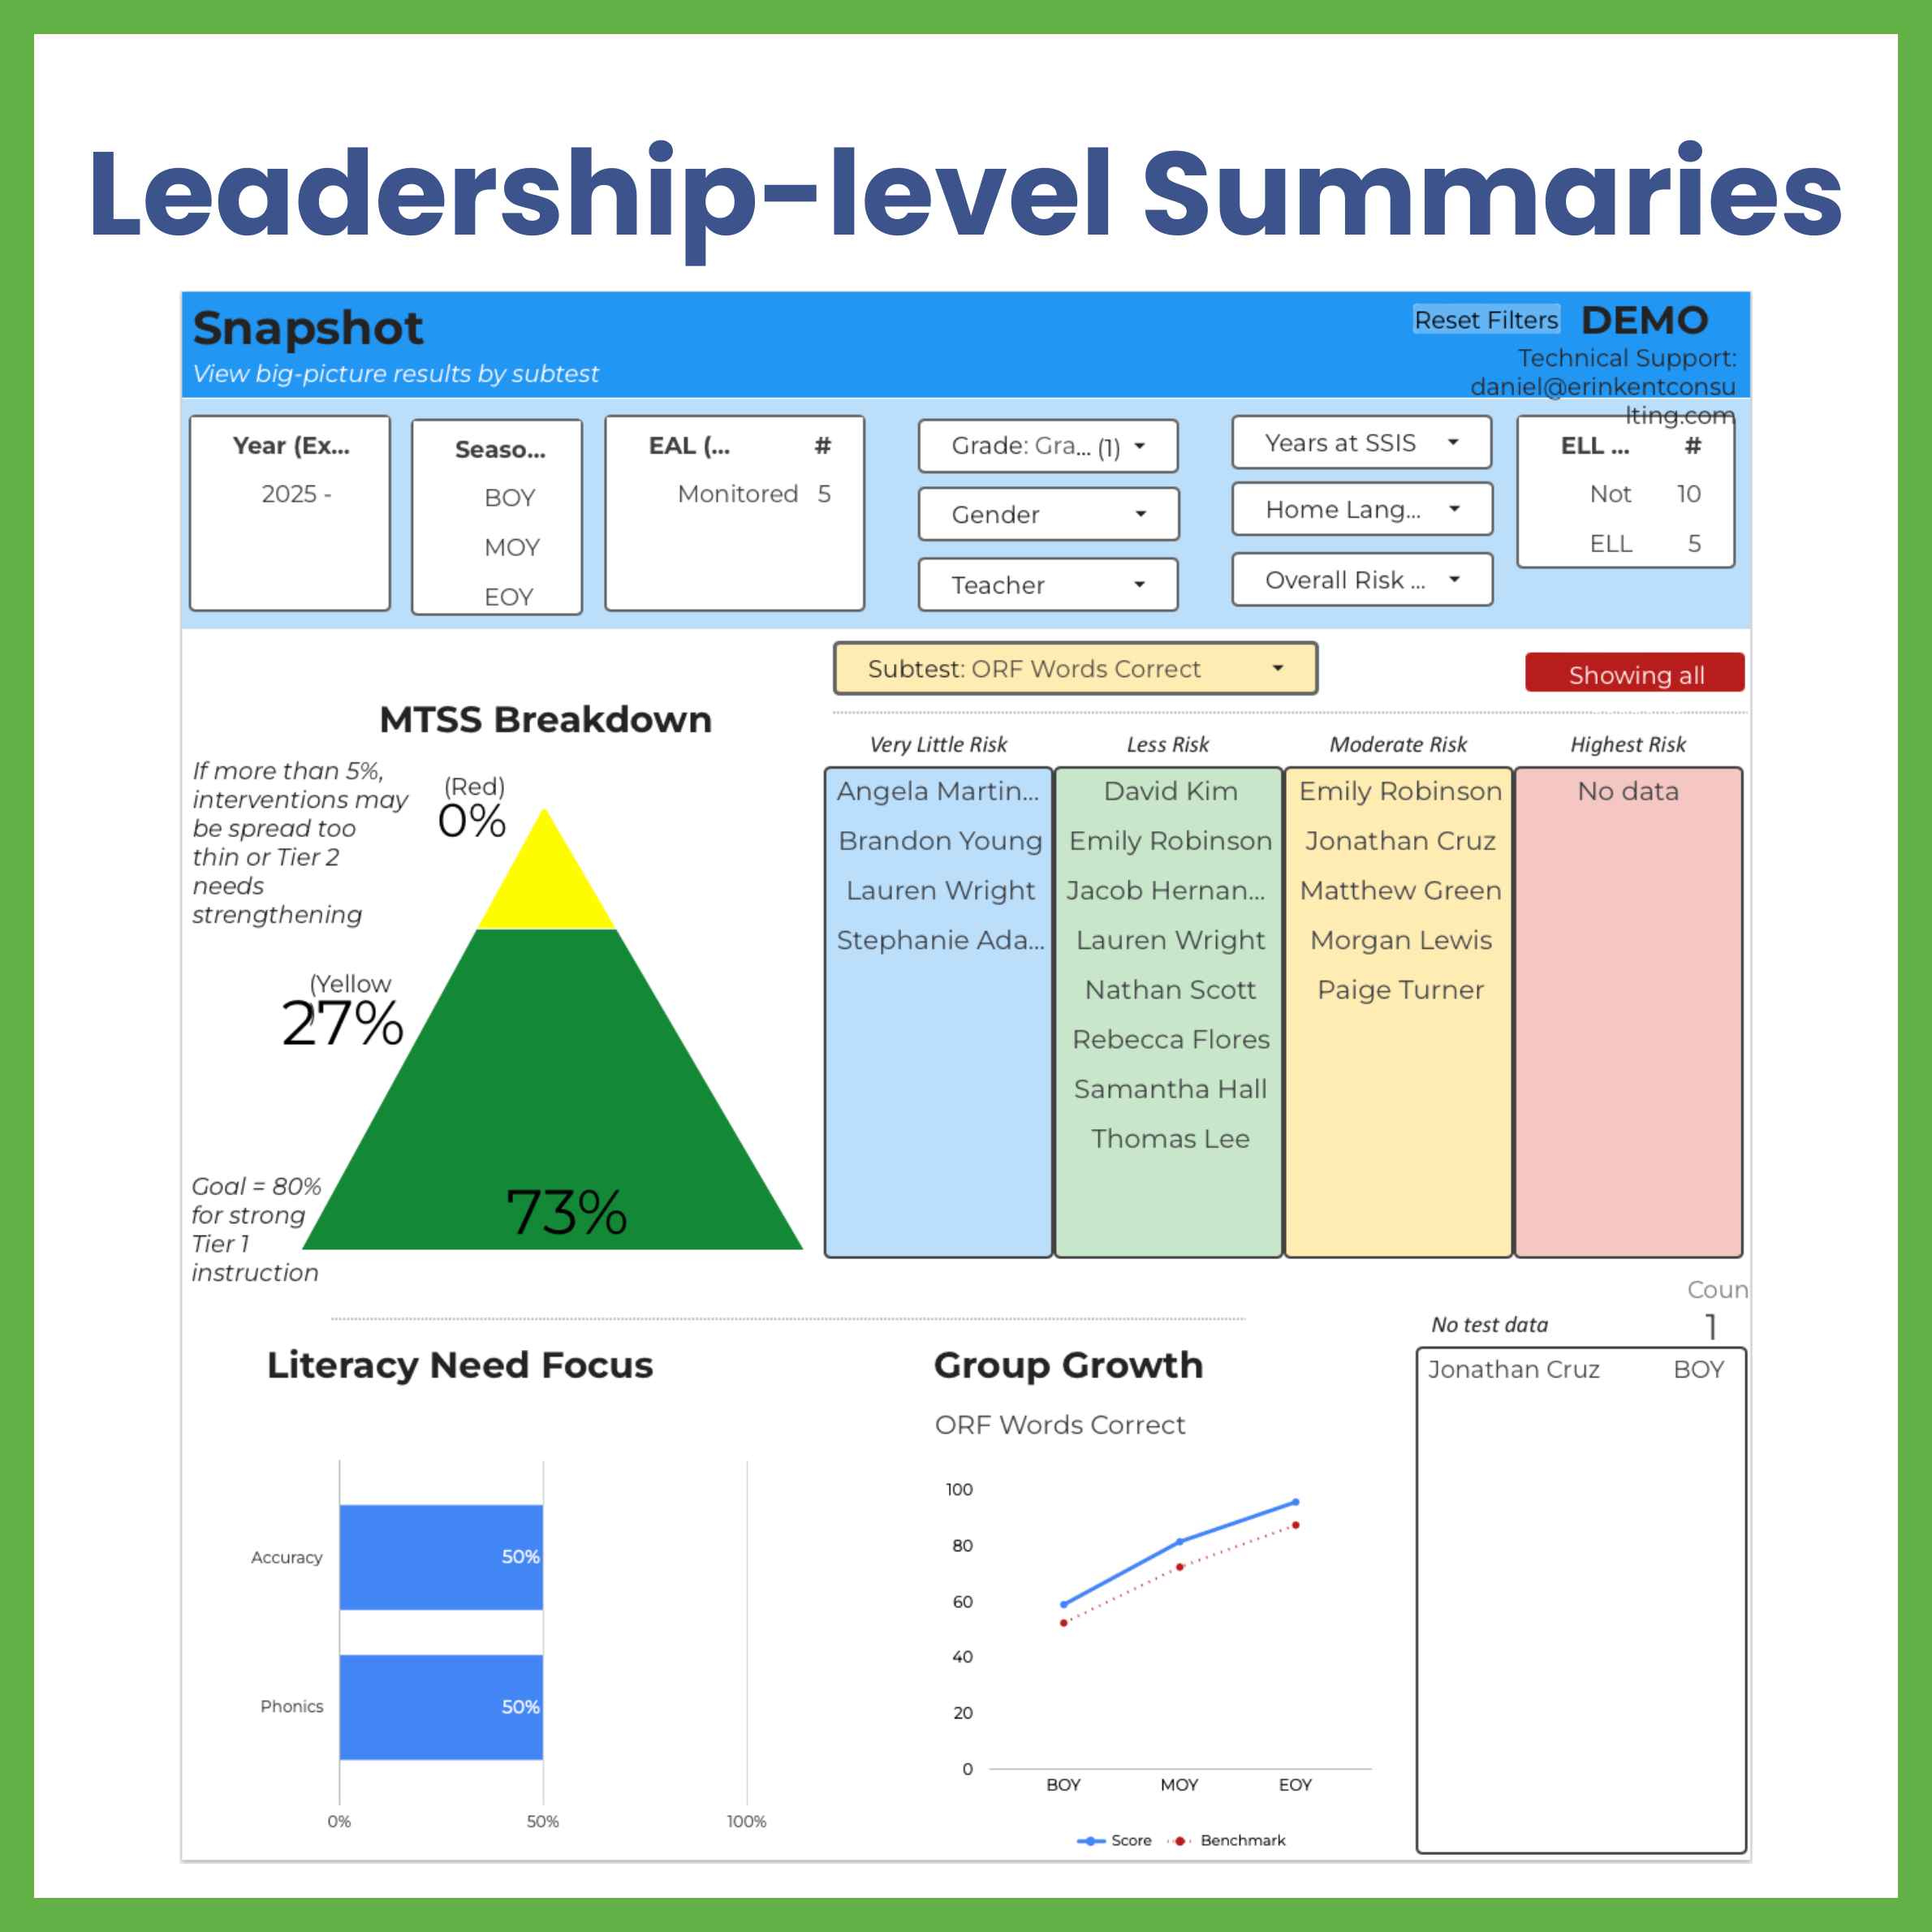
Teams can zoom in for detail.
They can zoom out for perspective.
Everything lives inside your school’s Google environment — practical, secure, and built for real educators. We build your dashboard around:
Onboarding & Support
Onboarding takes place via Zoom and focuses on:
Dashboard walkthroughs
Interpreting visual trends
Connecting data to instructional moves
Building confidence in conversations
We don’t just show you the visuals.
We help you use them.
After onboarding, your team maintains and updates the dashboard independently. Optional troubleshooting support is available if technical questions arise.

Let’s Bring Clarity to Your Data Conversations
Schedule a consultation to explore what a customized dashboard could look like in your context.
Together, we will:
Map your assessment ecosystem
Identify what matters most to your team
Build visualizations that support instructional decision-making
Design views for teachers, coaches, and leadership